Simplicate dashboard
Simplicate is excellent at what it does. A real-time management overview of your hours, projects, pipeline, and revenue is not part of that. We can help with that and provide personalised Simplicate dashboards for your whole team.
We connect directly to your Simplicate environment and build a custom dashboard, so your leadership has the picture it needs, without anyone digging through the platform to find it.


Simplicate handles your sales pipeline, project planning, time tracking, and invoicing well. The people who work in it every day find it for what it was designed to do.
The problem is that a large share of the people who need information out of Simplicate, directors, finance leads, account managers, and operations, are rarely on the platform. They want to know where things stand, quickly and clearly, on their own terms.
That’s when a dashboard that pulls your Simplicate data in real time and presents it clearly, to the right people, in the right format comes in handy.
- Directors and finance leads rely on Simplicate users to pull numbers for them, because getting to the right data takes time and platform knowledge.
- Getting a management overview means logging in, navigating to the right module, and applying the right filters, a process that takes longer than people are willing to repeat every week
- By the time someone has pulled a report and shared it, the data it's based on is already a day or two old
-Hours, pipeline, and project health live in separate areas of Simplicate, and pulling them into a single view requires manual work every time
We connect directly to your Simplicate environment via the API and build a dashboard that reflects your specific setup: your project structure, your people, your definitions. Every Simplicate configuration is different, and so is every dashboard we build.
We connect to your Simplicate environment. Your dashboard updates automatically, so anyone who opens it is always looking at current data, with no manual intervention required.
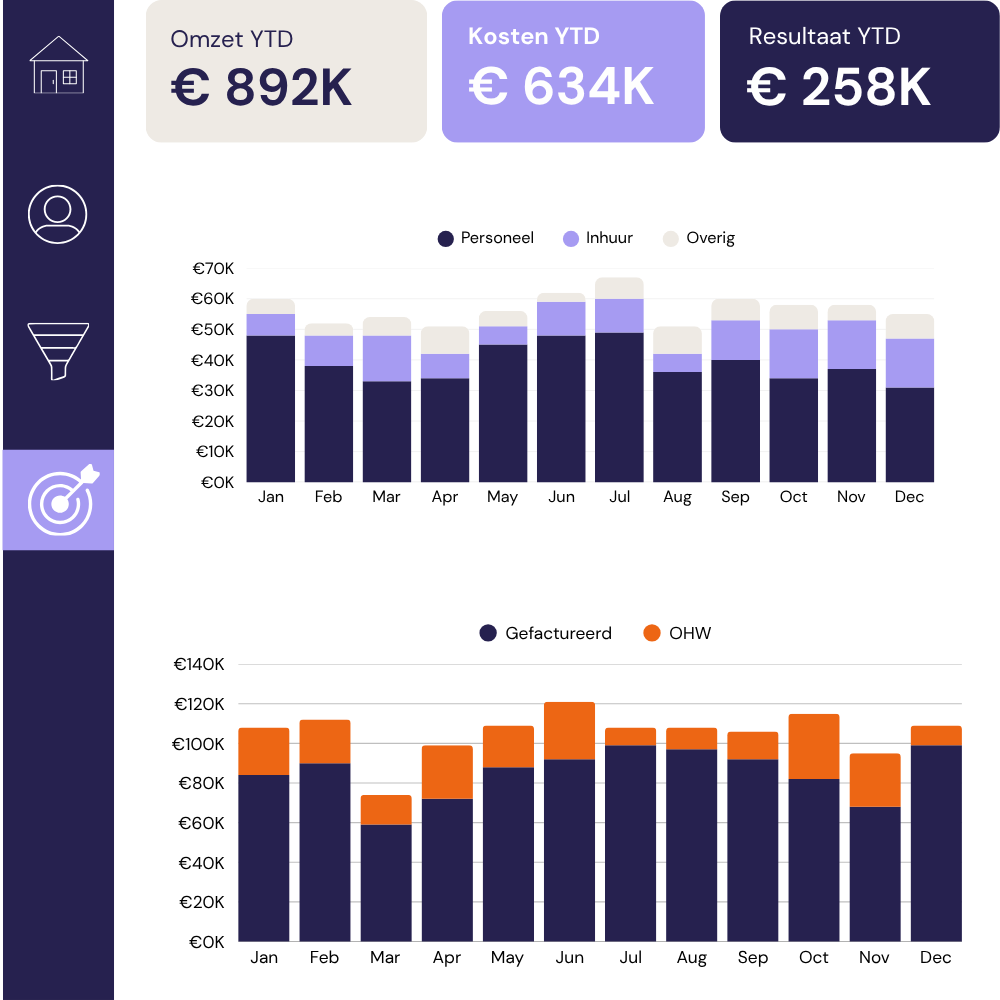
Simplicate organises data around projects and workflows. Your dashboard reorganises that same data around the questions your directors and management asks: margin by client, utilisation by person, revenue in progress, pipeline by stage.
We look at how you’ve set up Simplicate, your project types, your people, and your billing structure, and build a dashboard that reflects your company specifically.
The Simplicate dashboard makes that visible at a glance, so commercial decisions are based on what the numbers show rather than what people assume.
Role-based access means directors see the full picture, project leads see their own portfolio, and finance sees what it needs. The right level of detail reaches the right person without anyone seeing what they should not.
When your full picture requires data from your accounting software, a separate HR system, or anything else, we can bring that in. The Simplicate connection is the starting point, and we can build from there.
Every business has configured Simplicate slightly differently, and every management has different reporting priorities. We start with a focused 20-minute call to understand your setup: how your projects are structured, which numbers are important, and where the current reporting gaps are causing the greatest friction.
We’ll also be straightforward about what the build will involve, what will need adjusting for your setup, and anything in your requirements that falls outside what the Simplicate API can provide.
Before we touch your Simplicate data, we put together a mockup that shows you the structure of your dashboards: which views are included, how they’re laid out, and how your specific metrics will be presented. This is the stage to tell us if something is missing or if the layout needs rethinking.
Getting this right before we build saves everyone time.
We connect to your Simplicate environment via the API and start pulling through the data. This is where we sort out the logic: how your business defines billable hours, how you calculate project margin, and which project types feed into utilisation calculations. We document all of it so the numbers in the dashboard match the numbers your people expect to see.
Where relevant, we also connect additional sources alongside Simplicate: your accounting software, a separate HR system, so your overview is as complete as it needs to be.
Learn more about a Composable Data Hub from here.
You’ll have a working dashboard on your Simplicate data to open and share internally. We refine it in short cycles based on your feedback, adjusting views, adding metrics, and changing how things are grouped or labelled, until every person who needs to use it finds it immediately useful.
Handover includes full documentation of every connection and measure we’ve built, a walkthrough session with your team, and a clear conversation about ongoing support. Some clients manage everything themselves from that point. Others keep us involved for updates as their business changes.
Learn more about Data Team as a Service here.
These are the views Simplicate users typically find they need once they have a proper dashboard in front of them. We build each one from scratch around your specific configuration, and if your business needs something different, that’s what we build instead.
A top-level summary of where the business stands: revenue in progress, hours logged this period, pipeline value, and key trend indicators. Built for the first thing a director opens on a Monday morning.
Billable vs non-billable hours broken down by team, person, and period. Utilisation rates and capacity headroom so you can see where you’re overstretched and where there’s room to take on more work.
Budgeted vs actual hours per project, realisation rates, and an early warning view for projects that are drifting over scope before the client notices. The view your project managers wish they’d always had.
Revenue by client, open invoices, work in progress value, and a view of which clients are growing and which are shrinking. Useful for account management decisions and for understanding where your revenue is actually coming from.
Your Simplicate CRM data turned into a proper pipeline view: conversion by stage, weighted forecast, average deal size, and time-in-stage visibility. The overview your commercial team needs to manage deals.
Every business uses Simplicate differently. There’s always a view, yours to define: a specific team’s performance, a particular service line, a client-facing report, or something else your business needs to track closely.
Issue 4 | April 2026 AI is designing running in the background, managing workflows, learning your preferences, and embedding itself into the infrastructure your company already runs on. Anthropic launched Claude Design. OpenAI released GPT-5.5 and landed a major AWS partnership. Google renamed Looker Studio back to Data Studio. Snowflake’s Intelligence platform got a personal […]
What happened in data and AI? If February was about AI growing up, March is about AI actually doing things. Actually running pipelines, detecting threats, writing and executing code, holding a real-time conversation in over 200 countries simultaneously. The stuff that came out this month are on the theme of autonomy. And the question of […]
This article is part of a series on how i-spark uses AI in our work. For an overview of the three main categories of AI use: ideation, code assistance, and data analysis, see our companion article. AI-assisted coding is now standard practice across data initiatives, with code writing and code reviewing. Most development teams use […]