Looker Studio dashboard

Your Google data, turned into a dashboard.

Looker Studio connects natively to GA4, Google Ads, Search Console, BigQuery, and the rest of the Google ecosystem. That native connection is what makes it powerful for businesses running on Google data. 

We build custom dashboards on top of it that turn those sources into a single, clear view you can use to make decisions.

Your Google data is all there, you just need a clear view.

GA4, Google Ads, Search Console, BigQuery: the data your business runs on is spread across platforms that each show you their own slice of the picture. Every Monday someone exports something, pastes it into a spreadsheet, and tries to make it tell a coherent story before the weekly review.

By the time the report is ready, it is already out of date. And the next time a question comes up mid-week, the whole process starts again.

A proper Looker Studio setup

A custom Looker Studio dashboard built around your Google data setup.


We connect directly to your Google properties: GA4, Google Ads, Search Console, BigQuery, and any other sources in scope ,and build a dashboard that brings everything into one view, updated automatically, designed around the decisions it needs to support.

The metrics are defined the way your business defines them. The layout is built for the people who will use it. And because it is connected to your live data, it is ready the moment anyone opens it.

What you gain

What a well-built Looker Studio dashboard does for your business.

Looker Studio is at its best when the data sources are clean, the metrics are defined correctly, and the layout is built around the decisions it needs to support. Here is what that delivers.

Your marketing data stops living in separate tabs


Every source your reporting draws on is brought into a single view, refreshed automatically, so the full picture is in one place every morning.

Budget and performance conversations become faster


When the numbers update themselves and everyone is looking at the same dashboard, the time spent preparing for a weekly marketing review drops from an hour to a glance.

The metrics reflect how your business defines them


Calculated fields and blended data sources are built around your specific definitions, so conversion rate, ROAS, and cost per lead mean the same thing in the dashboard as they do in your strategy documents.

Non-Google data sources pulled in alongside Google ones


Meta Ads, LinkedIn, CRM data, offline conversions: where your full picture requires sources outside the Google ecosystem, we connect them so the dashboard reflects the whole of your marketing activity.

Shareable with clients or stakeholders


Looker Studio reports are browser-based and shareable via a link. A client-facing version of your dashboard requires a share setting, not a licence, an export, or an extra platform.

Built to evolve as your reporting needs change


Because every dashboard is built from scratch around your setup, adding a new data source, a new metric, or a new view later is a matter of extending what is already there.

The process

What happens after you get in touch?

01. Understanding your data sources, your metrics, and what the dashboard needs to do

A 20-minute call to understand which Google properties and other data sources are in scope, how your business defines its key metrics, and who will use the dashboard and for what decisions. We also look at your current reporting setup to understand where the frustrations are.

By the end of the call we can tell you what the build will involve, how long it will take, and whether anything in your data setup needs to be resolved before we start.

02. A visual layout of your dashboard before any data is connected

Before we touch your data sources, we put together a mockup showing the structure of your dashboard: which views are included, how they are laid out, and where each metric sits. This is the stage to tell us if something is missing, if a section needs rethinking, or if the layout does not match how your reporting audience reads the business.

Getting this agreed on first is what keeps the build clean.

03. Data sources connected, metrics defined, and the dashboard built 

We connect your data sources, set up the calculated fields that define your metrics correctly, and build the dashboard on your data. For blended sources, combining GA4 with ad platform data, for example, we make sure the joins are clean and the aggregations are accurate.

We will share a working version with you as soon as it is ready to look at. From there, we refine based on your feedback until every section is exactly right.

Inside your daashboard

The dashboards we typically build in Looker Studio

Every dashboard is built from scratch around your data sources, your metric definitions, and the audience who will use it. These are the views businesses ask for most often in Looker Studio.

1

Marketing performance overview


Sessions, conversions, cost, and revenue across all channels in a single view. The dashboard your marketing lead opens first to understand how activity is translating into results.

2

Paid media dashboard


Spend, impressions, clicks, CPC, ROAS, and conversion data across Google Ads, Meta, LinkedIn, and any other paid channels in scope. Built for those who manage budget allocation and need to see channel performance side by side.

3

SEO and organic performance


Impressions, clicks, CTR, and average position from Search Console combined with organic session and conversion data from GA4. The view your SEO or content lead needs to track keyword trends, page performance, and how organic activity feeds into the funnel.

4

Client-facing reporting dashboard


A shareable, branded dashboard for reporting to clients. Built to show the metrics clearly, without exposing internal benchmarks or budget details they should not see. Shared via link, updated automatically, nothing to export or prepare.

5

E-commerce and revenue tracking


GA4 e-commerce data combined with ad spend and CRM revenue, where available, gives you a joined-up view of acquisition cost, conversion rate by channel, and revenue attribution. 

6

Custom view


Every business uses a slightly different combination of tools and tracks slightly different metrics. The view will be defined in the discovery process around what your business  needs to see, rather than being fitted into a category that does not match.

Let's build a dashboard worth opening every day!

Exlore our other data solutions

Dashboards, assessments, stack setup, and custom builds. Backed by expert analysis to support data-driven decision-making and strategic growth.

Power BI dashboard

Custom Power BI dashboards on top of your existing data sources, connected to your live systems, designed around your business logic, and built so you can open them and trust what you see immediately.

Looker dashboard

Looker implementation from the ground up: LookML data model, custom dashboards, and access governance for  businesses that need a governed analytics layer they can actually rely on.

Looker Studio dashboard

Fully custom Looker Studio dashboards on top of your Google data sources: GA4, Google Ads, Search Console, BigQuery, so you gain a live, accurate view of performance.

Klipfolio dashboard

As an official Klipfolio partner, we build custom dashboards for real-time KPI monitoring across any data source, deployed faster than heavier BI platforms and backed by certified partner expertise.

Simplicate dashboard

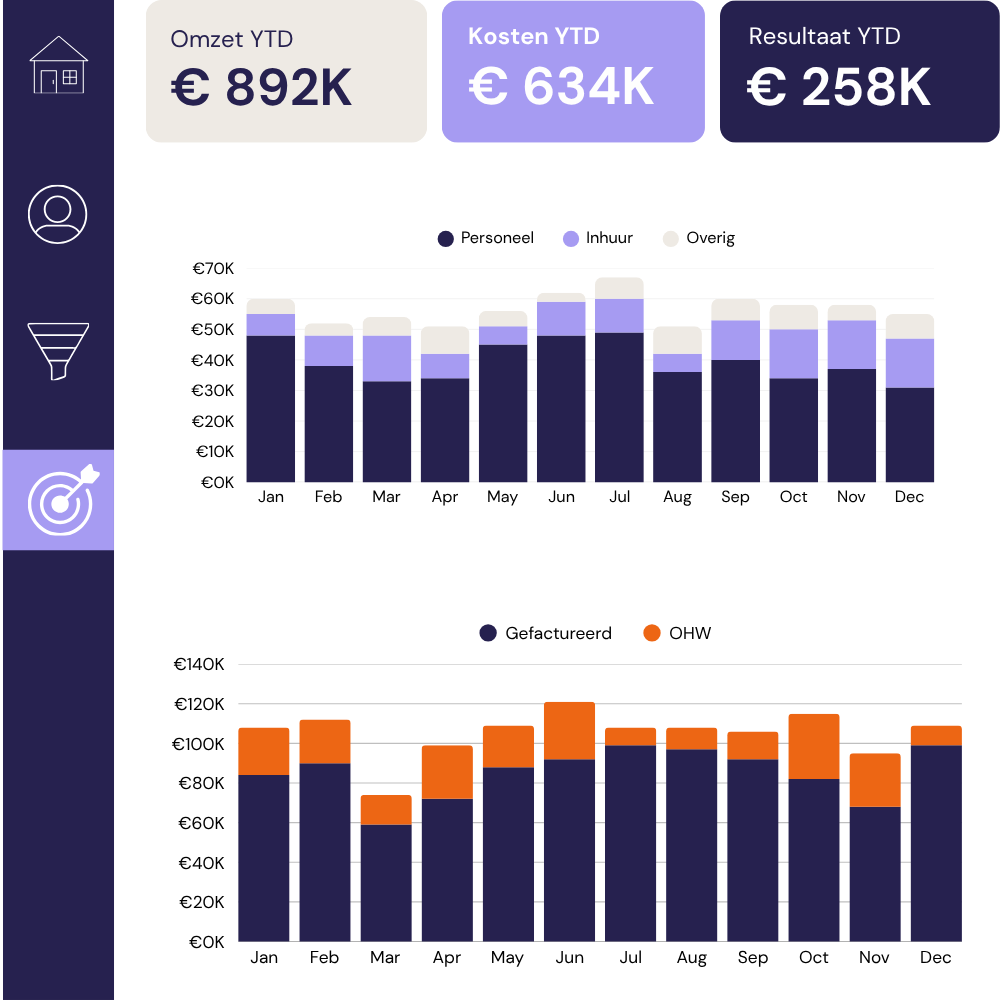
If your business runs on Simplicate, we connect directly to your environment and build a custom dashboard that gives you a live overview of hours, projects, pipeline, and margin.

Data Assessments

Before you invest in data tooling, platforms, or hires, a data assessment gives you an honest picture of where your setup stands today: what is working, where the gaps are, and a plan for what to do next.

Power BI/dbt x Claude Code setup

Connect Claude Code directly into your dbt and/or Power BI environment in 1 day, tested against your models and datasets; handed over with a walkthrough so you can use it immediately.

Custom B2B data solution

For B2B agencies and consultancies that need practical data insight, we build custom solutions covering live dashboards, structured data outputs, automated KPI alerts, and interactive reports.

Fully custom data product

Looking for something you don’t see in our modular product range? Our data and AI expertise goes well beyond what is listed here. Tell us what you need and we will build it.