B2B data solutions
B2B businesses run on billability, project margins, utilisation, and client retention. We build fully custom data solutions that give your leadership a clear, current view of it all.
We will look at how your business currently tracks performance, understand which components fit your situation, and give you a clear picture of what the build involves.


B2B agencies and consultancies have a specific set of performance metrics that consumer businesses do not deal with in the same way: billability targets, project profitability per client, utilisation across a delivery team, and the health of long-term client relationships.
The numbers determine whether the business is actually sustainable, and they tend to be the hardest to pull together quickly.
What agencies and consultancies need is a practical data setup: the right metrics, connected to the right sources, delivered in a format the people who need them can use immediately.
We build every component from scratch around your specific setup: your tools, your metric definitions, your reporting audience, and how your business calculates the numbers that matter to it. Billability, utilisation, project margin, SLA performance, client health, defined your way.
The solution is modular. You take the components that fit where you are today. Each one addresses a specific gap in how you currently see performance data.
The four data solutions
Each solution addresses a different way your leadership needs to interact with data. They work well together, and each one also stands on its own depending on where your business needs to start.
Those are examples, a custom solution is always an option!
Clean, intuitive dashboards that highlight your KPIs, without overwhelming your team with unnecessary noise.
We design dashboards with clarity, speed, and usability in mind, so your team can monitor performance and act with confidence.
Prefer to analyse data in Excel or build your own pivot tables? No problem.
We deliver clean, structured datasets optimised for finance teams, operations analysts, or anyone who wants to dig into the numbers manually.
Stay ahead of problems with automated KPI alerts and threshold monitoring.
We help you set up data-driven triggers that alert you when something important changes, so you can take timely action.
Dynamic reports that combine narrative, visuals, and data to give stakeholders a full picture.
Perfect for internal presentations, team reviews, or client-facing SLA reporting.
A 20-minute call to understand how you track performance today, which systems your data lives in, and where the gaps are costing your leadership time or visibility. From there, we design a solution around your specific situation.
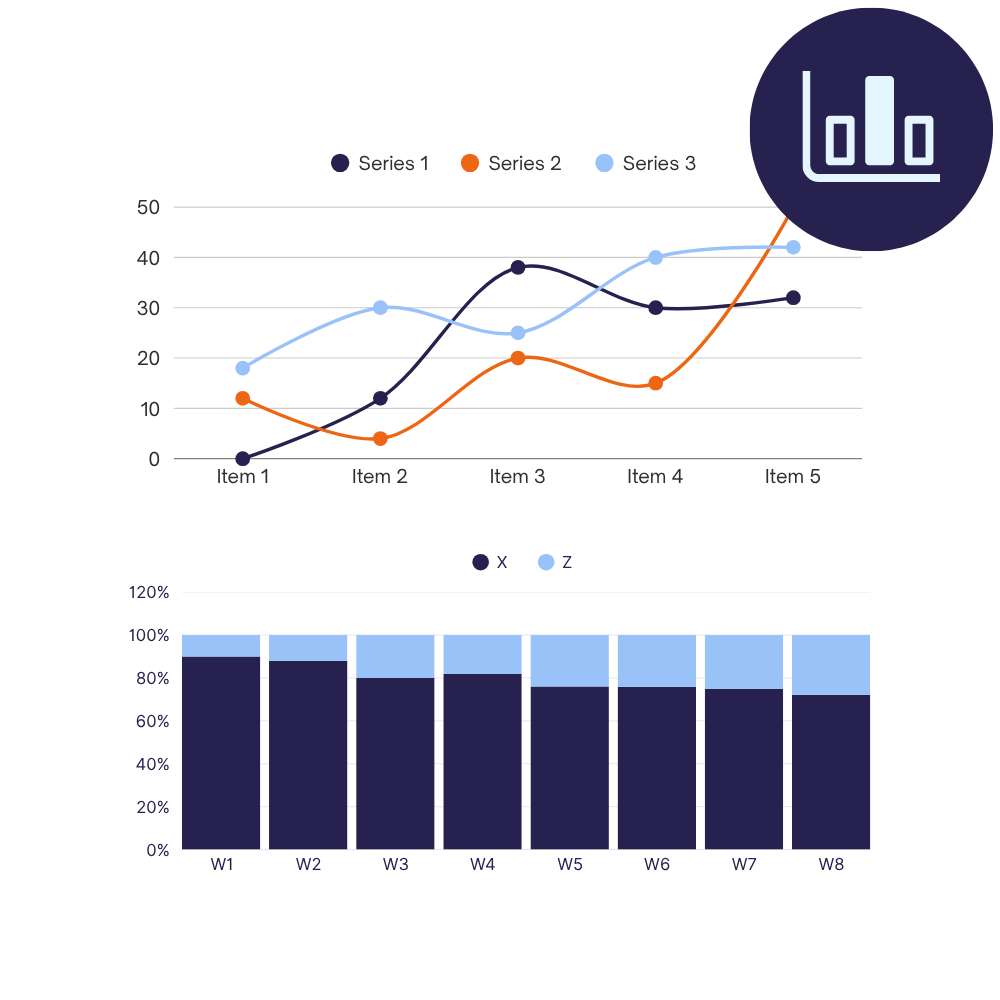
Before we connect a single data source, we put together a mockup showing exactly what your solution will look like: which metrics appear where, how the dashboards are structured, what the report format looks like, and where the signal thresholds sit. This is the stage to tell us if a metric is missing or a layout does not match how you reads performance.
We connect your data sources, configure the metrics and calculations around your specific definitions, and build each solution on your real data. Billability, utilisation, project margin, SLA compliance: each metric is defined the way your business defines it.
We share a working version as soon as it is ready to review. From there we refine based on your feedback until every solution is exactly right for the people who will use it.
The goal is never the dashboard itself. It is what your business can do differently once the right data is in front of the right people at the right time.
Project profitability visible in real time means a client engagement drifting below the margin floor gets flagged while there is still scope to act, before the invoice goes out and the damage is locked in.
When the numbers update themselves and the reports are generated automatically, the time you spent pulling data together every week goes back into the business.
Knowing in real time which people are overstretched and which have capacity means resourcing conversations happen earlier, and hiring decisions are grounded in what the data shows.
When SLA performance, project progress, and delivery metrics are available in a format you can share directly with clients, the quality of account conversations improves because both sides are looking at the same numbers.
Access to historical project margin data by client type, service line, and team makes it possible to price new work based on what actually happened on comparable projects rather than gut feel and optimism.
Current data replaces last week’s export. The questions that used to wait for a Monday morning report get answered the moment someone asks, which changes how quickly and confidently decisions are made.
Issue 4 | April 2026 AI is designing running in the background, managing workflows, learning your preferences, and embedding itself into the infrastructure your company already runs on. Anthropic launched Claude Design. OpenAI released GPT-5.5 and landed a major AWS partnership. Google renamed Looker Studio back to Data Studio. Snowflake’s Intelligence platform got a personal […]
What happened in data and AI? If February was about AI growing up, March is about AI actually doing things. Actually running pipelines, detecting threats, writing and executing code, holding a real-time conversation in over 200 countries simultaneously. The stuff that came out this month are on the theme of autonomy. And the question of […]
This article is part of a series on how i-spark uses AI in our work. For an overview of the three main categories of AI use: ideation, code assistance, and data analysis, see our companion article. AI-assisted coding is now standard practice across data initiatives, with code writing and code reviewing. Most development teams use […]