Official Klipfolio partner

Custom Klipfolio dashboards.

We design and build flexible, user-friendly dashboards tailored to your KPIs, helping you track performance, make better decisions, and scale with confidence.

Our founder has established a strong partnership between i-spark and Klipfolio, delivering great outcomes for more than 12 years.

Klipfolio is built for real-time KPI visibility.

Klipfolio is a powerful platform for live operational monitoring. The issue is that a lot of Klipfolio setups never get past a handful of default Klips pulled from one or two data sources. The platform is in place but the dashboards are incomplete, the data connections are fragile, and the business is still not seeing the real-time picture it signed up for.

Getting to a dashboard that delivers requires knowing how to structure the data connections, how to build Klips that stay reliable, and how to design a layout that gives the right people the right view at the right time.

The problem is solved - with Klipfolio.

A fully custom Klipfolio dashboard built from an official partner, done properly.


As an official Klipfolio partner, we bring certified platform expertise, a direct escalation route to Klipfolio's product and support teams, and partner-level pricing to every build.

For businesses already on Klipfolio, we also audit and rebuild what is there, fixing fragile connections, completing missing views, and getting the platform to deliver what it was installed for.

What you gain

What a well-built personalised Klipfolio dashboard gives your company.

Klipfolio’s strength is real-time operational visibility. Here is what that delivers when the dashboard is built around your specific KPIs and connected to your live data sources.

You stop waiting for someone to pull a number


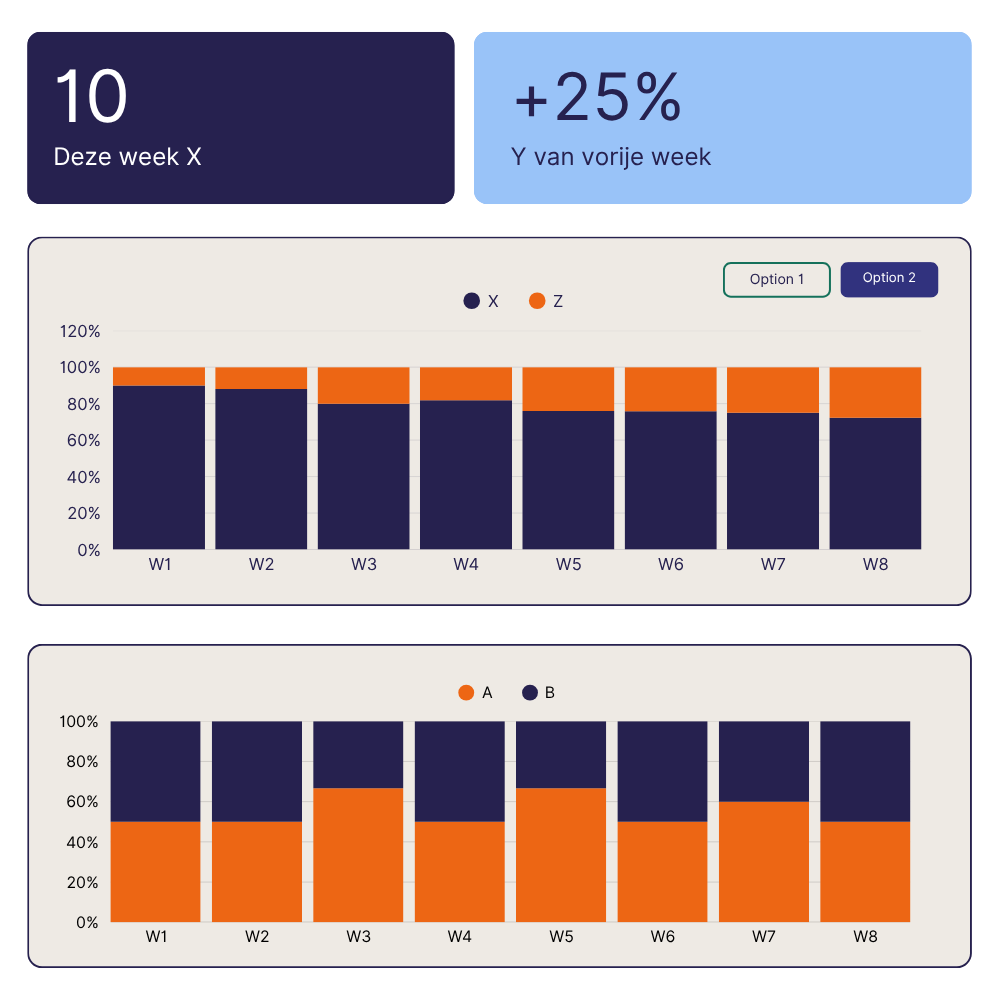
Every KPI you check regularly is live on the dashboard, updated automatically from your data sources. The question gets answered the moment it is asked, without a request, an export, or a delay.

Operational issues surface before they become problems


Live data means a spike in open tickets, a dip in SLA compliance, or a drop in conversion rate is visible the moment it happens, while there is still time to respond.

Data from every tool your business uses, in one place


CRM, support platform, finance system, marketing tools, databases: Klipfolio’s connectors bring all of it into a single dashboard without a data engineering project to get there. 

Partner expertise and pricing on every build


As an official Klipfolio partner, i-spark brings certified platform knowledge, a direct relationship with Klipfolio’s team for escalations and edge cases, and partner-level licensing rates that reduce the cost of the platform for every client we work with.

A working dashboard in days


Because Klipfolio is purpose-built for this type of deployment, a custom dashboard built by an official partner reaches a working first version faster than any other platform. The time goes into defining the right KPIs.

The process

What happens after you get in touch?

01. Understanding your KPIs, your data sources, and who needs to see what

A 20-minute call to understand which metrics your business tracks, where that data currently lives, and who the dashboard is built for. We also want to understand the decisions the dashboard needs to support.

By the end of the call, we can tell you what the build will involve, how long it will take, and whether anything in your data setup needs attention before we connect it.

02. A visual layout of your dashboard before we connect anything 

Before we connect a single data source, we put together a mockup showing the structure of your dashboard. This is the stage to tell us if a metric is missing, if the layout does not match how your leadership reads performance, or if a section needs rethinking entirely.

Getting the structure agreed on before connecting data keeps the build clean and the timeline predictable. Changes at the mockup stage are fast. 

03. Data sources connected, and the dashboard is built live on your data

With the mockup agreed, we connect your data sources, configure the metrics and calculations, and build the dashboard on your real data. Klipfolio’s connector library means this stage moves quickly, for common sources like Salesforce, HubSpot, Google Analytics, and Xero, the connections are established and validated within hours.

We share a working version as soon as it is ready to review. From there we refine based on your feedback,  until every KPI on the dashboard is exactly right.

Inside your dashboard

The dashboards we typically build in Klipfolio

Every dashboard is built around your KPIs, your data sources, and the people who need to see it. These are the views businesses ask for most often.

1

Executive KPI dashboard


The single view your leadership opens to understand how the business is performing right now. Revenue, pipeline, key operational metrics, and trend indicators across every function, live, in one place.

2

Sales performance dashboard


Live pipeline, deals by stage, activity metrics, conversion rates, and quota attainment updated in real time from your CRM. Built for sales teams who need to see what is moving, what is stalling, and where to direct attention.

3

Operations and service delivery

SLA compliance, ticket volume, resolution times, capacity utilisation, and uptime indicators are updated as events happen. The operational view that lets you see pressure building before it becomes a complaint.

4

Marketing and campaign performance


Ad spend, impressions, clicks, conversions, and cost metrics across Google, Meta, LinkedIn, and any other channels in scope. When you need to see how the budget is performing across channels without logging into each platform separately.

5

Financial KPI monitoring


Revenue, margin, cash position, and budget vs actuals are pulled from your accounting software and updated throughout the day. The finance view that lets your CFO see where the business stands without waiting for month-end reporting cycles to close.

6

Customer success and retention monitoring


Churn indicators, health scores, onboarding progress, support ticket trends, and NPS data pulled from your CRM and support platform. Built for customer success leads who need to see which accounts are at risk and which are expanding, updated throughout the day.

Let’s build a Klipfolio dashboard that works for you!

We’re here to answer your questions

Questions we often hear Klipfolio dashboards.

Klipfolio is a cloud-based dashboarding platform that helps you visualise and track your business metrics in real time. It connects to a wide range of data sources like spreadsheets, CRMs, financial tools, and databases, so you can centralise your KPIs and monitor performance at a glance. It’s known for its flexibility, powerful custom visualisations (Klips), and its ability to scale with growing data needs.

No. If you’re new to Klipfolio, we’ll help you get set up with the right plan for your needs. If you’re already using it, we can work within your existing setup or improve upon it.

That’s exactly what the discovery and KPI planning stages are for. We’ll guide you through identifying the most impactful metrics based on your business goals and user needs.

That’s very common and part of the reason our clients work with us. During the intake phase, we assess the quality and availability of your data and advise on how to make it useful and reliable. Cleaning and structuring are often part of our work.

Absolutely. Our dashboards are designed for usability, and we offer optional training so your team feels confident updating and maintaining them.

Let’s debrief: data & AI | Issue 4, April 2026

Let’s debrief: data & AI | Issue 3, March 2026

AI-assisted code development: What you should know