At i-spark we enable commercial firms with online ambitions, such as web shops or subscription-based services, to bring a more critical focus by offering new insights. That sounds great, but how do we do this?
You can read more on this topic in our blog on rentability and revenue.
By analyzing, modelling, and visualizing existing data, by applying measuring points that do not yet exist in websites or apps, or by bringing together data from all areas. However, this only works when you use the right tools at the right moment, and for the right goals. There is not a single tool that can cover all areas of insight driven work. This collection, or better, piles of tools is what we call the ‘data stack’ and can be either standardized or custom-made work for our client.
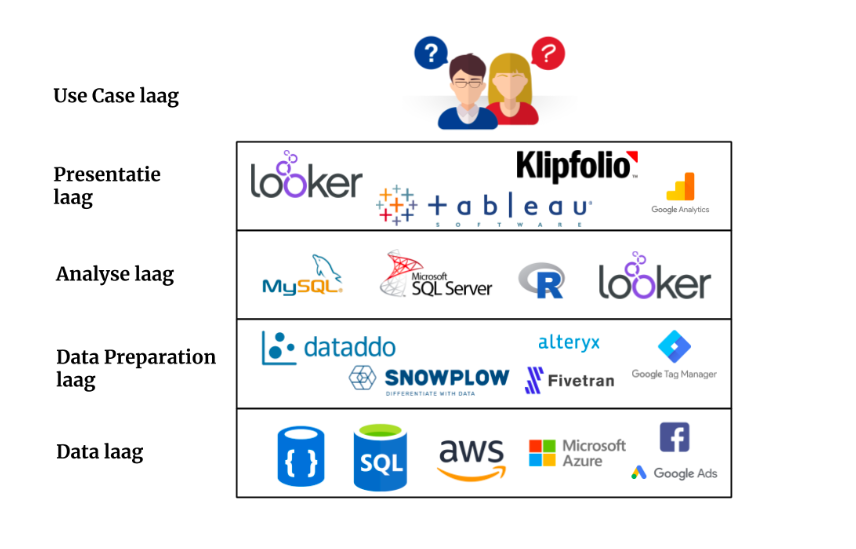
The goal of data, big or small, is to solve a business ‘problem’. Let us call this from here on out the use case. But which role does the data stack play in solving a use case? Below I will explain the data stack, starting from the bottom. Normally you work ‘top down’ from the use case, but to better understand the structure of the stack it is for now easier to start ‘bottom up’.
Data Layer
The bottom layer of the stack is the data itself. This is the raw data which is saved in countless of sources such as SQL and NoSQL databases, data warehouses or even data lakes. These sources are often in the cloud (Amazon AWS/Microsoft Azure/Google Cloud) or of course at the customer. The data from these sources can be extracted by making direct links with for example databases, but also via API’s. In case of online marketing, you can see the data from your email package, CRM, Google Analytics and Facebook (Ads) as a source at this level of the stack.
Data Preparation layer
The next layer in the stack is the Data Preparation. It might sound weird, but data is usually very messy and never in the right format when you try to combine these from multiple sources. Data Preparation is the process retrieving the data from sources, cleaning it, combine it, and by doing so prepare it for analysis. A few commonly known data preparation tools are Snowplow, Dataddo, Fivetran, Alteryx, and Tableau Prep. For retrieving the data from for example an e-commerce website we often use Google Tag Manager.
Analysis layer
After the data has been prepared for analysis, we can solve the question or use cases with the help of tools such as SQL, R, or SAS. Some BI of visualization tools, like Looker, have their own developed analysis programming language which enables data consultants to directly make the analysis in the visualization tool. This is also the layer where Machine Learning is right at home. The results can directly be shared or used in the next layer of the stack. Moreover, this layer is not always present in every use case.
Presentation layer
The outcomes of the analysis layer can serve as input for the presentation layer. It is also possible that this input layer comes directly from the data preparation layer or even data layer if there is for example only 1 source. An example of this is Google Analytics. The data is loaded on the Google server and as an end-user you can see this collected data in the interface of Google Analytics. De output of the presentation layer depends on the use case and usually is ‘the last mile’ in data analysis.
- In many use cases this last step is a BI or visualization tool such as Klipfolio, Looker, or Tableau. With the help of these tools the results of an analysis of information from multiple sources are visualized in such a way that they create helpful insights.
- In other cases, it could be that the output of this layer is used as a feed for different systems. For example, enhanced ecommerce data from your web shop, which is send via Google Tag Manager to Google Analytics to make a visualization of the sales. But also as product feeds to platforms such as Google Shopping, Bol.com, or Amazon.
Use Case Layer
The use case layer is the top layer and the end goal of the data stack. The use case determines the choice of tools in all underlying layers of the data stack. The number of use cases is almost infinite. Increasingly demanding use cases require the expansion of data and thus also create a growth in solutions in the data stack in order to continue to generate insights.
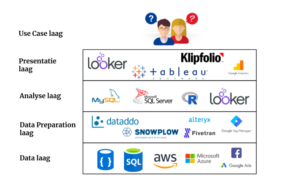
Examples of Data Stacks
The layering of a Data Stack is not always as flat as described above. Depending on the customer’s use case, there are many variants of the stack. Below are two examples of variation in the layering of the Data Stack
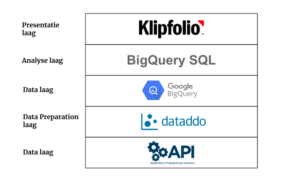
Example 1:
There is a desire to visualize data from a project management tool because the tool itself does not provide for this sufficiently. The data can only be accessed via an API with a limit of 100 rows of data per request. This means that you can request a maximum of 100 rows of data at a time. Suppose the source contains 100.000 rows and the visualization tool, in this case Klipfolio, can only handle 1 API request at a time. Then you need to create more than 1000 data sources to retrieve all the data. This is not maintainable, confusing and very error-prone. In order to solve this, an intermediate step is needed, namely merging the data from all the required API requests into Dataddo and then putting that data into a Google BigQuery database. In this way we reduce the number of data resources required in Klipfolio to just 1(!) and, in addition to visualizations, we can also perform analyses on all combined data. In this use case the Data Stack consists of an extra data layer:
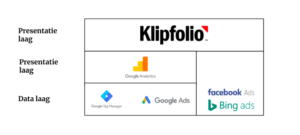
Example 2:
The costs from campaigns of Google Ads are in Google Analytics. In addition, Google Analytics, via an Enhanced Ecommerce implementation in Google Tag Manager, also contains information about product sales. In addition, advertising is also done via Facebook and Bing Ads. Campaign cost information from both sources is combined with sales information in Klipfolio and visualized as Cost Per Order per channel.
In general, a number of known combinations of tools such as Data Stacks can be defined. In addition, we as experts also have a preference for a number of tools that are jointly used as a stack for our customers, especially when it comes to comparable use cases. An illustration of the Data Stack of a use case that we get more often from our customers can be found above.
Some well-known data stacks are:
- Snowflake – Fivetran – Looker
- AWS – Alteryx – Tableau
At i-spark we often use the following combinations in addition to the aforementioned examples to answer use cases for our customers:
- Snowplow – SQL – Visualization tool
- APIs – Dataddo – Klipfolio
- Snowplow – Looker
- Google Tag Manager – Google Analytics
Data Engineer at i-spark
As a Data Engineer I play an important role in advising and setting up the right tools in every layer of the Data Stack in order to be able to answer our customers’ use cases. The use cases and data sources at our customers are clear and present in 90% of the projects. Using my experience in development and product management, I can then work with the i-spark team and the customer to find out how we can use the Data Stack for different use cases. In this way we bring together data from all angles and gaps and you as a commercial company with online ambitions can gain sharper focus through new insights.
Curious about what we can do for your use cases? Mail or call us!
Jeroen