Data is essential, but collecting it is not enough. The real value is in how insights are communicated and used. In our new initiative, we are working with Kaj van der Plas, 3storybuilding to offer two practical workshops: Data Storytelling and Dashboard Design.
We zien vaak organisaties met veel gegevens, maar weinig duidelijkheid over hoe deze te vertalen naar beslissingen. Dit is waar data storytelling en een effectief dashboardontwerp het verschil maken.
Two ways to deliver insights
Data teams typically provide value in two ways:
- Insights for decision-making – Analysis and reporting that help teams take action.
- Automated data flows – Enriched data feeds that operationalize processes and support AI.
While automated data runs in the background, insights need interpretation and structure. Data professionals use two key tools for this purpose:
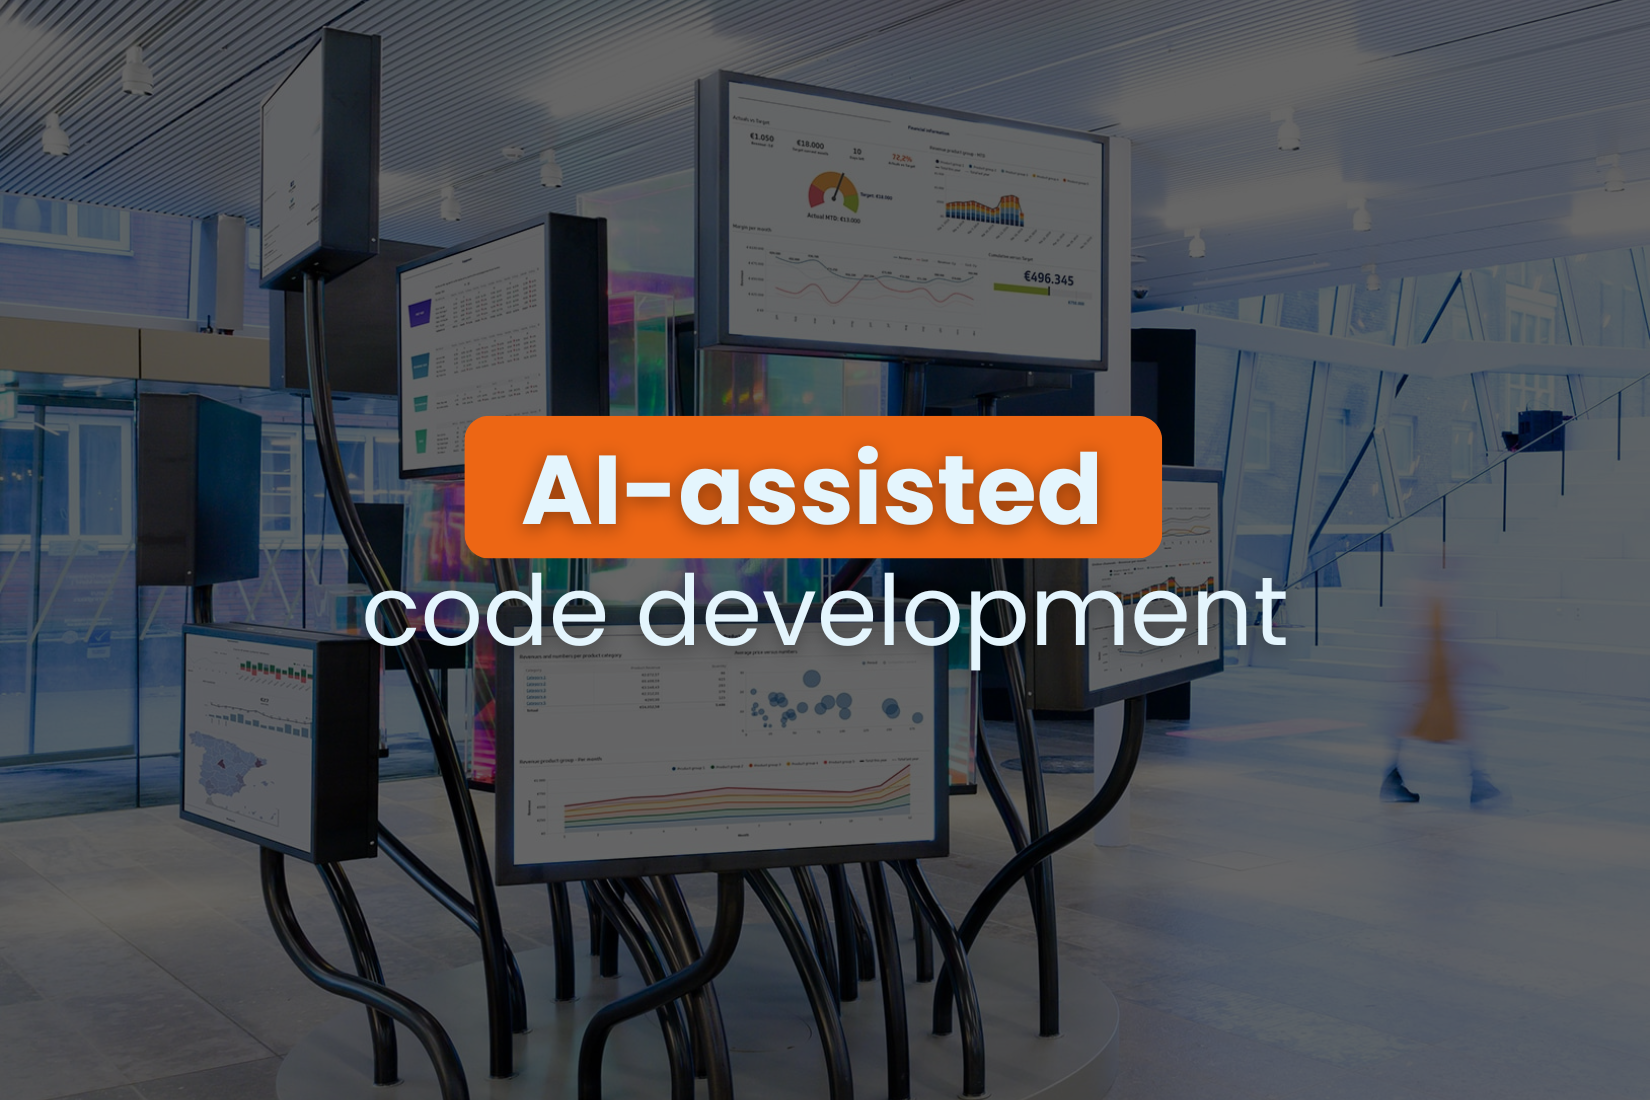
- Dashboards – For ongoing monitoring and exploration.
- Analysis – Diving deep into data to explain key insights and turn them into a clear story.
Dashboards support exploration and help users find patterns on their own. Analysis, on the other hand, is about explanation, turning data into a clear narrative that guides decision-making.
Why this matters
Companies that use dashboards for exploration and analytics for explanation make better decisions. Just as UX design improves dashboards, data storytelling improves the delivery of analytics. But many professionals lack the training to do both effectively.
Therefore, we are introducing two practical workshops:
- Data Storytelling Workshop – Learn to communicate insights clearly and effectively.(Available now!)
- Dashboard Design Workshop – Learn what makes a dashboard useful and how to design it properly.(Coming soon!)
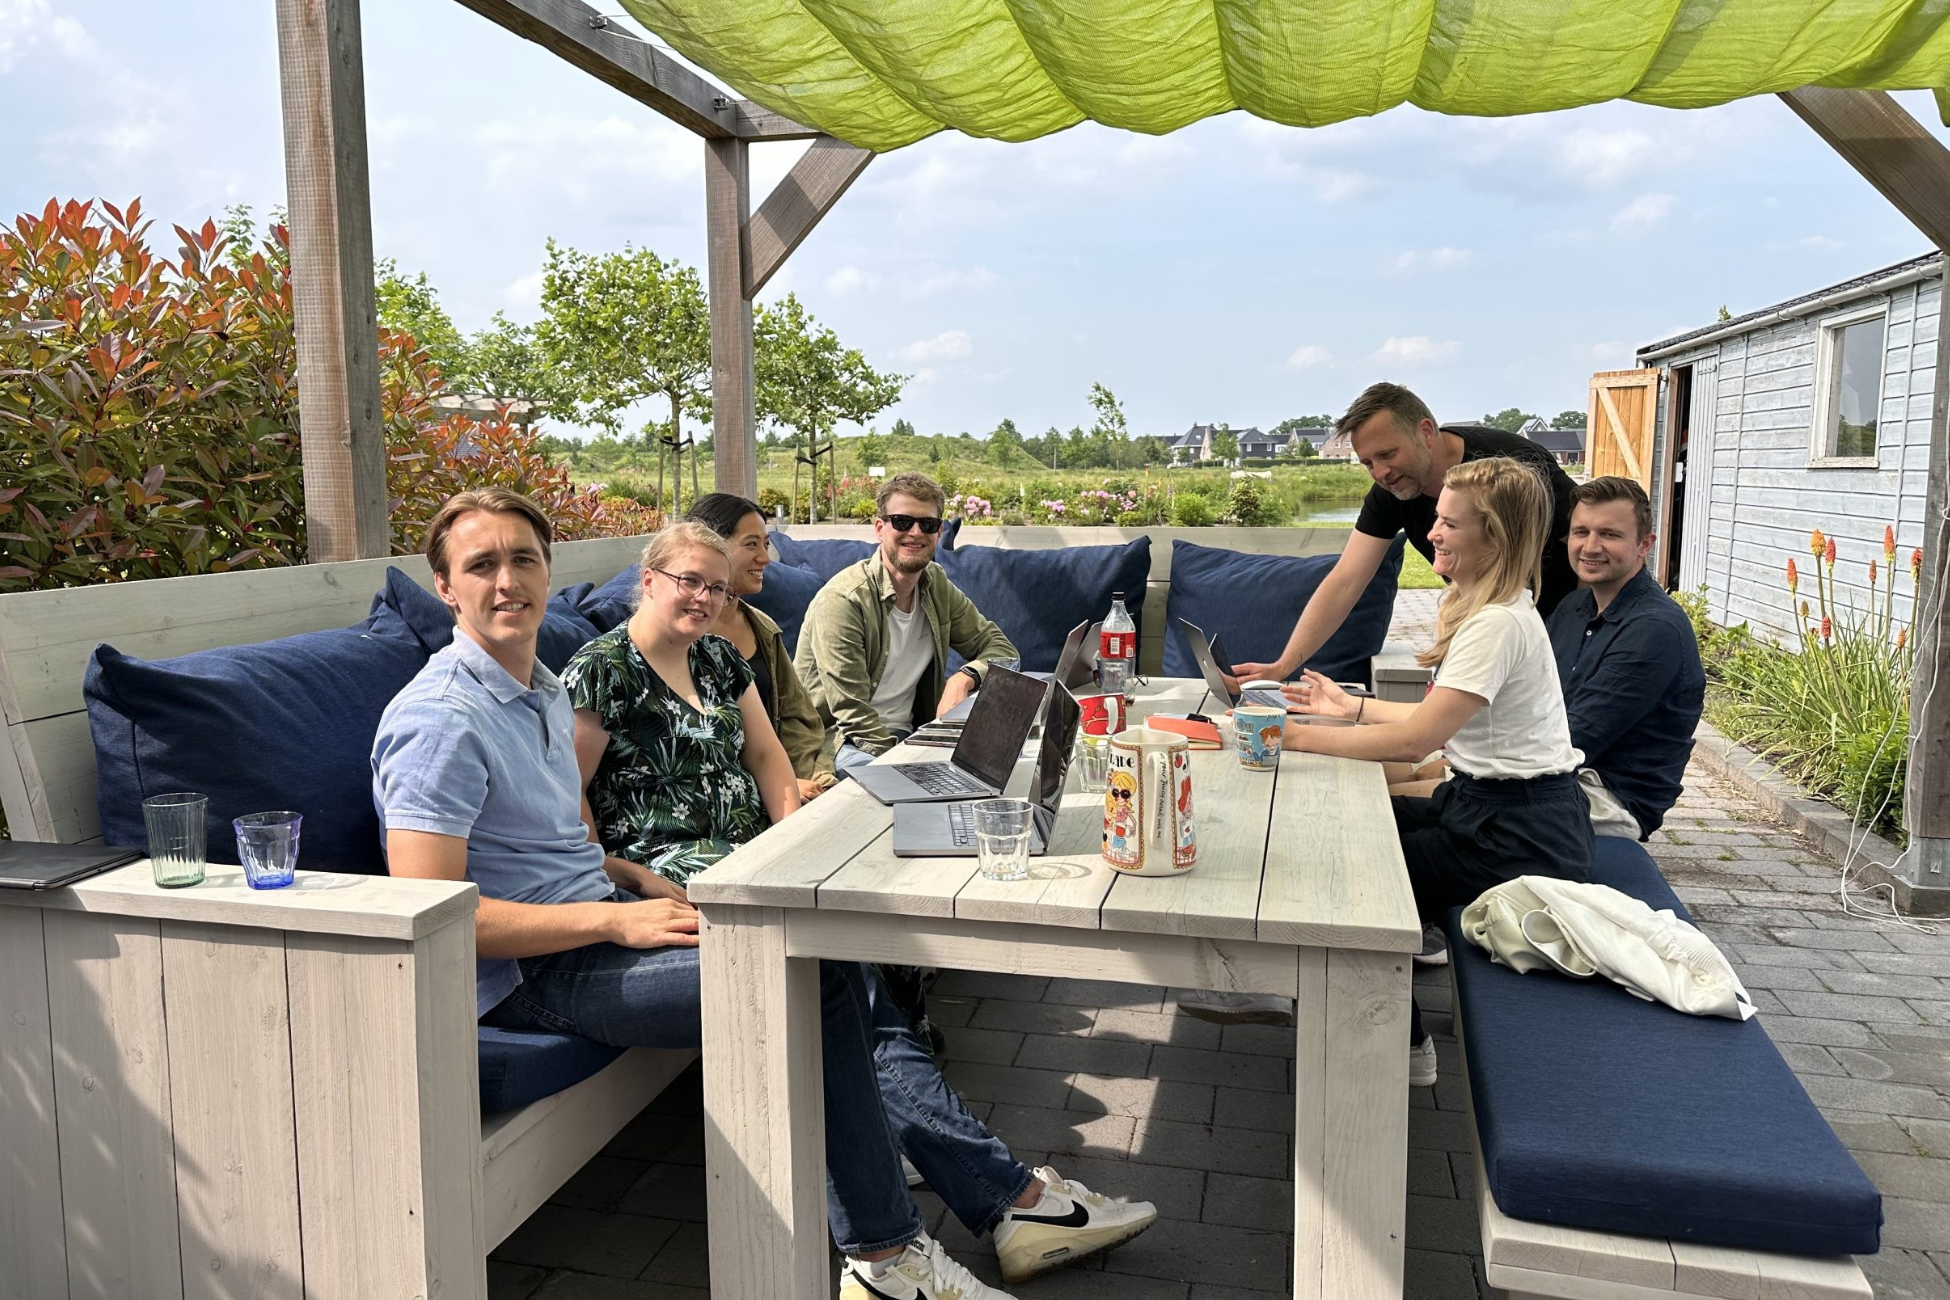
A practical collaboration
At i-spark, we understand data. Kaj van der Plas understands storytelling. This collaboration brings clear, effective learning directly to teams, on location and at a competitive price.
For data teams, this is an opportunity to hone their skills. For companies, it’s an opportunity to make data work better.
Interested? Let’s talk.