
Ik kan i-spark van harte aanbevelen op basis van hun expertise en de uiterst prettige samenwerking.
- Hans Krol, KAW Architekten en Adviseurs
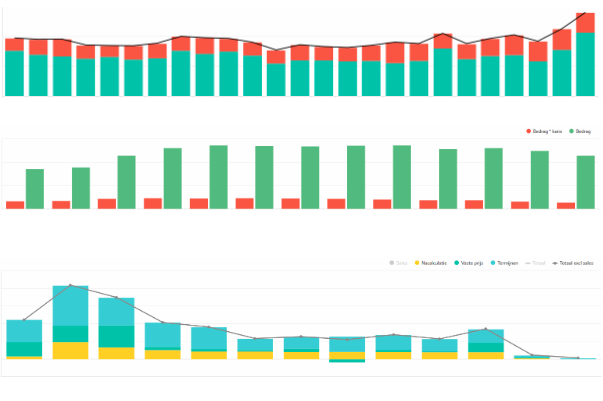
Case bekijkenHans Krol, Adviseur Kwaliteit bij KAW Architekten en Adviseurs is zelf aan de slag gegaan met een dashboard, maar liep al gauw tegen problemen aan. Hans vertelt: Ik had al een ontwerp gemaakt van de gewenste dashboards. En ik ben bezig geweest met het ontsluiten van de data van Simplicate via de API. Daar liep ik al snel tegen de zogenoemde limiet van 100 aan. Daarnaast bleek dat het dashboard op het eerste gezicht er bijzonder simpel uit te zien maar om de data te visualiseren zijn er ingewikkelde berekeningen nodig om bijvoorbeeld de Sales prognose te verdelen over de maanden, hetzelfde geldt voor de prognoses van projecten op basis van nacalculatie. Het bleek dat hiervoor ook in de gebruikersvriendelijke tools voor Dashboards heel wat programmeerwerk nodig is. Hiervoor heb ik i-spark benaderd en ben samen met hen dit avontuur aangegaan.
Voor onze financiële prognoses is historie erg belangrijk maar deze wordt nergens opgeslagen in Simplicate. Daarom hebben we een route gekozen, waarbij iedere dag een set van alle benodigde data uit Simplicate wordt opgeslagen in een eigen database en met Klipfolio wordt met deze data het dashboard gevisualiseerd. De data wordt opgehaald met query’s die ik niet zelf kan schrijven, maar i-spark juist wel.
Inzicht
in rentabiliteit en omzetten
Hans Krol - Adviseur Kwaliteit bij KAW Architekten en Adviseurs
Zonder de hulp van i-spark hadden de dashboards niet gerealiseerd kunnen worden. Vooral gewaardeerd heb ik de hands-on mentaliteit en het praktische meedenken en vooral ook de ervaring met data waardoor er al even verder werd gekeken dan alleen het dashboard bouwen met de drang om deze ook zo robuust mogelijk te maken. Ik kan i-spark van harte aanbevelen op basis van hun expertise en de uiterst prettige samenwerking.
lees meer over onsIs jullie onderneming actief in de B2B dienstensector?
Draai je projecten voor vaste prijs en/of op regiebasis/op basis van nacalculatie, strippenkaarten of abonnementen? Heb je behoefte aan meer inzicht in de winstgevendheid van die projecten en de medewerkers? Maak je al gebruik van software voor je urenadministratie?
Daar waar de accountant je helpt bij de boekhouding en de bedrijfskundige bij je bedrijfsprocessen en de keuze van je bedrijfssoftware, helpt i-spark om de schatten van informatie die in die pakketten zitten te ontsluiten en te vertalen in een dashboard op basis waarvan jij inzicht krijgt in de rentabiliteit en omzetten. Niet zozeer vanuit en boekhoudkundig perspectief, maar meer gericht op de bedrijfsvoering. Onze ervaring en die van onze klanten, is dat dit onderdeel vaak onderbelicht is in dit type software.
Lees hierover meer in onze blog over dit onderwerp.
Het doel
Het doel van deze opdracht was het opzetten van een data architectuur, zodat de juiste data in het dashboard kon worden gevisualiseerd. Voor de financiële prognoses van KAW is het hebben van historie in het dashboard erg belangrijk, daarom wordt nu via een database oplossing historie opgeslagen en met de juiste query’s opgehaald en in Klipfolio getoond.
Diensten
Voor het ontwikkelen van de dashboards van KAW hebben wij Data Analyse, Data Engineering en Data Visualisatie ingezet.
Benieuwd hoe we jou kunnen helpen? Neem vrijblijvend contact met ons op!